HET time use statistics
Time use statistics
Average statistics for how time is spent between
18-deg twilights at night
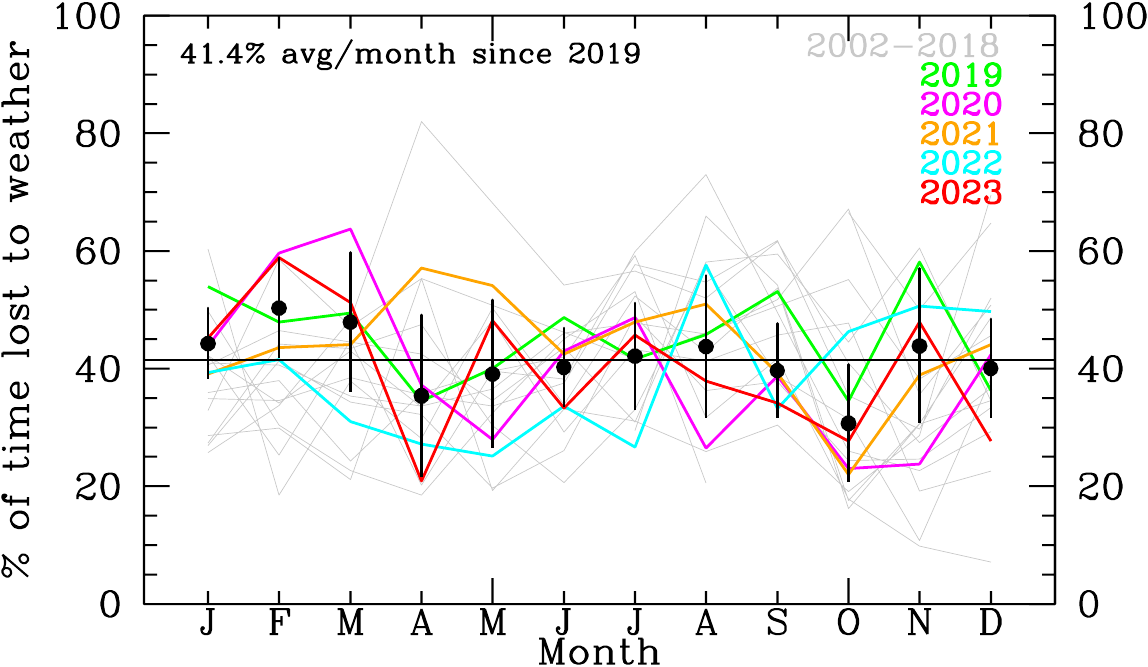
The plot below shows the average time lost
to weather each month. The data from 2017 onward are the
finest-grained and most representative of our current operations.
Overall from 2019-2023 our average time lost to weather was ~41%.
(in board meeting folder of plots)
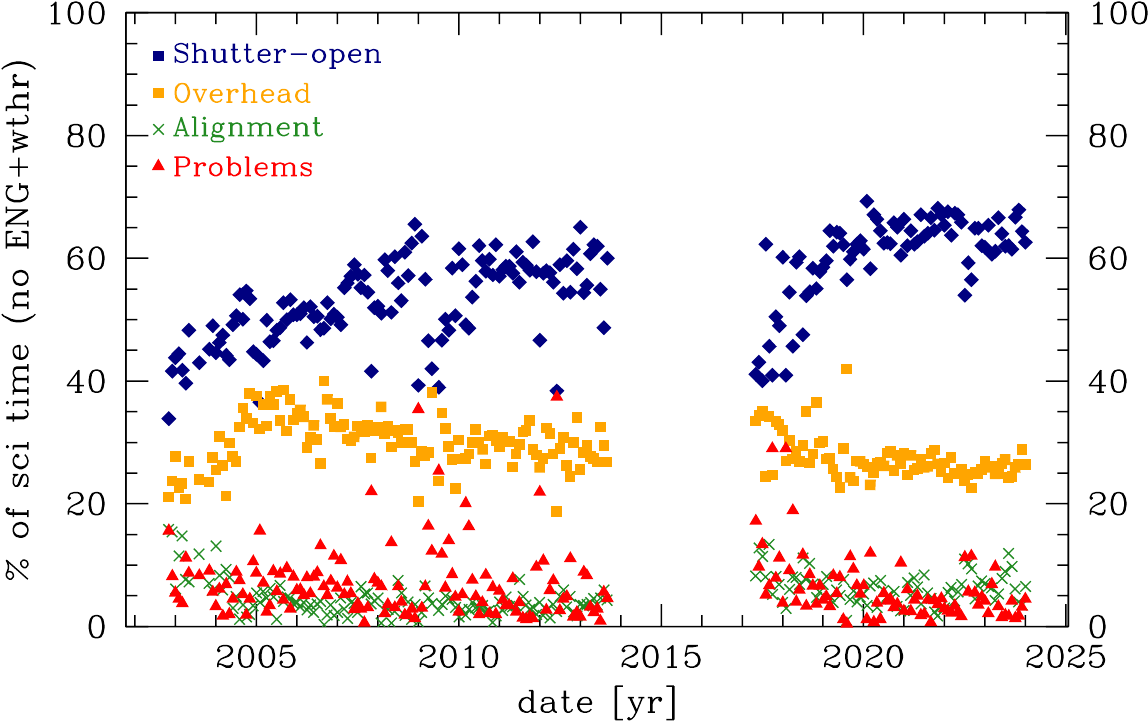
The plot below shows the breakdown of time spent *after* removing
idle time due to weather and engineering time.
Monthly averages:
average of all data below from: 2017-04-01 to 2023-12-31 (civil)
|
Idle
%
|
Stack
%
|
Problems
%
|
Engineering
%
|
Science
exposures
%
|
Science
overhead
%
|
Jan
|
43.7
|
3.1
|
3.5
|
5.7
|
31.1
|
12.9
|
Feb
|
48.7
|
2.8
|
2.9
|
7.2
|
26.7
|
11.8
|
Mar
|
46.1
|
2.7
|
3.2
|
15.9
|
22.8
|
9.3
|
Apr
|
35.1
|
3.5
|
2.8
|
13.4
|
32.1
|
13.2
|
May
|
37.9
|
3.9
|
2.4
|
12.0
|
30.5
|
13.2
|
Jun
|
40.7
|
4.9
|
3.6
|
10.3
|
27.2
|
13.2
|
Jul
|
42.2
|
3.8
|
2.2
|
13.6
|
26.1
|
12.2
|
Aug
|
45.6
|
3.7
|
3.5
|
8.3
|
26.7
|
12.1
|
Sep
|
44.5
|
2.7
|
3.8
|
8.3
|
28.7
|
11.9
|
Oct
|
36.6
|
2.6
|
3.0
|
14.2
|
30.1
|
13.4
|
Nov
|
40.7
|
2.8
|
3.5
|
7.4
|
31.2
|
14.5
|
Dec
|
43.3
|
2.7
|
2.5
|
4.4
|
32.6
|
18.7
|
ALL
|
42.2
|
3.2
|
3.2
|
10.2
|
28.5
|
12.7
|
Note: "Idle" includes:
poor weather (clouds, rain, wind speed, work-downwind,
seeing, humidity, etc)
queue hole
See full listing of monthly time use
here
Last updated: Wed, 17 Jan 2024 16:35:59 +0000 stevenj

|
|
|